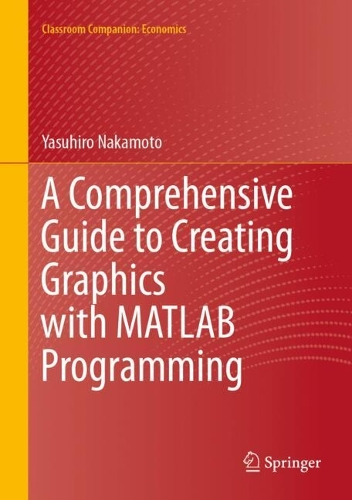
A Comprehensive Guide to Creating Graphics with MATLAB Programming
Synopsis
This textbook teaches you how to use MATLAB to create high-quality graphs using student-friendly statistical data at a level of mathematics accessible to middle or high school students. With more than 500 illustrated examples, this book quickly guides you to the essential information you need to create and customize high-quality graphs without requiring advanced mathematical knowledge. MATLAB gives you complete control over the appearance of each component in your graph. For example, in addition to creating the main graph, such as a scatter plot, line graph, bar graph, or histogram, you can also customize lines, legends, captions, titles, axis labels, gridlines, and many other elements.
Whether you use this book for teaching and research or not, you will have the incredible power of MATLAB graphics at your fingertips.
Publisher information
- Publisher: Springer Nature Switzerland AG
- ISBN: 9789819662128
- Number of pages: 580
- Dimensions: 240 x 168 mm
- Languages: English
Customer Reviews
You may also like...